
Annonse
How can data visualization have a political impact?
In this blog entry, we will take a closer look at how data visualization can impact politics. Is it possible that data visualizations can influence how politics is governed, or how democracy works?
In this entry, I'll present four perspectives that show some of the most important ways in which data visualization can impact politics and democracy.
1. Data visualization and public debate
For democracy to function properly, we need a well-informed public debate about issues that are of concern to society at large. Such as the level of taxation, abortion, and other questions. Data visualization is often a part of these public debates.
One example is media discussions regarding transport, and car policy. Here, data visualization showing the levels of carbon emission are used to support political arguments, whether the aim is to increase train travel or increase taxes on fuel. In this way, data visualization becomes part of the discussions that are shaping our opinions on important political questions, and possibly how we choose to vote in elections.
Annonse
2. Data visualization and ideology
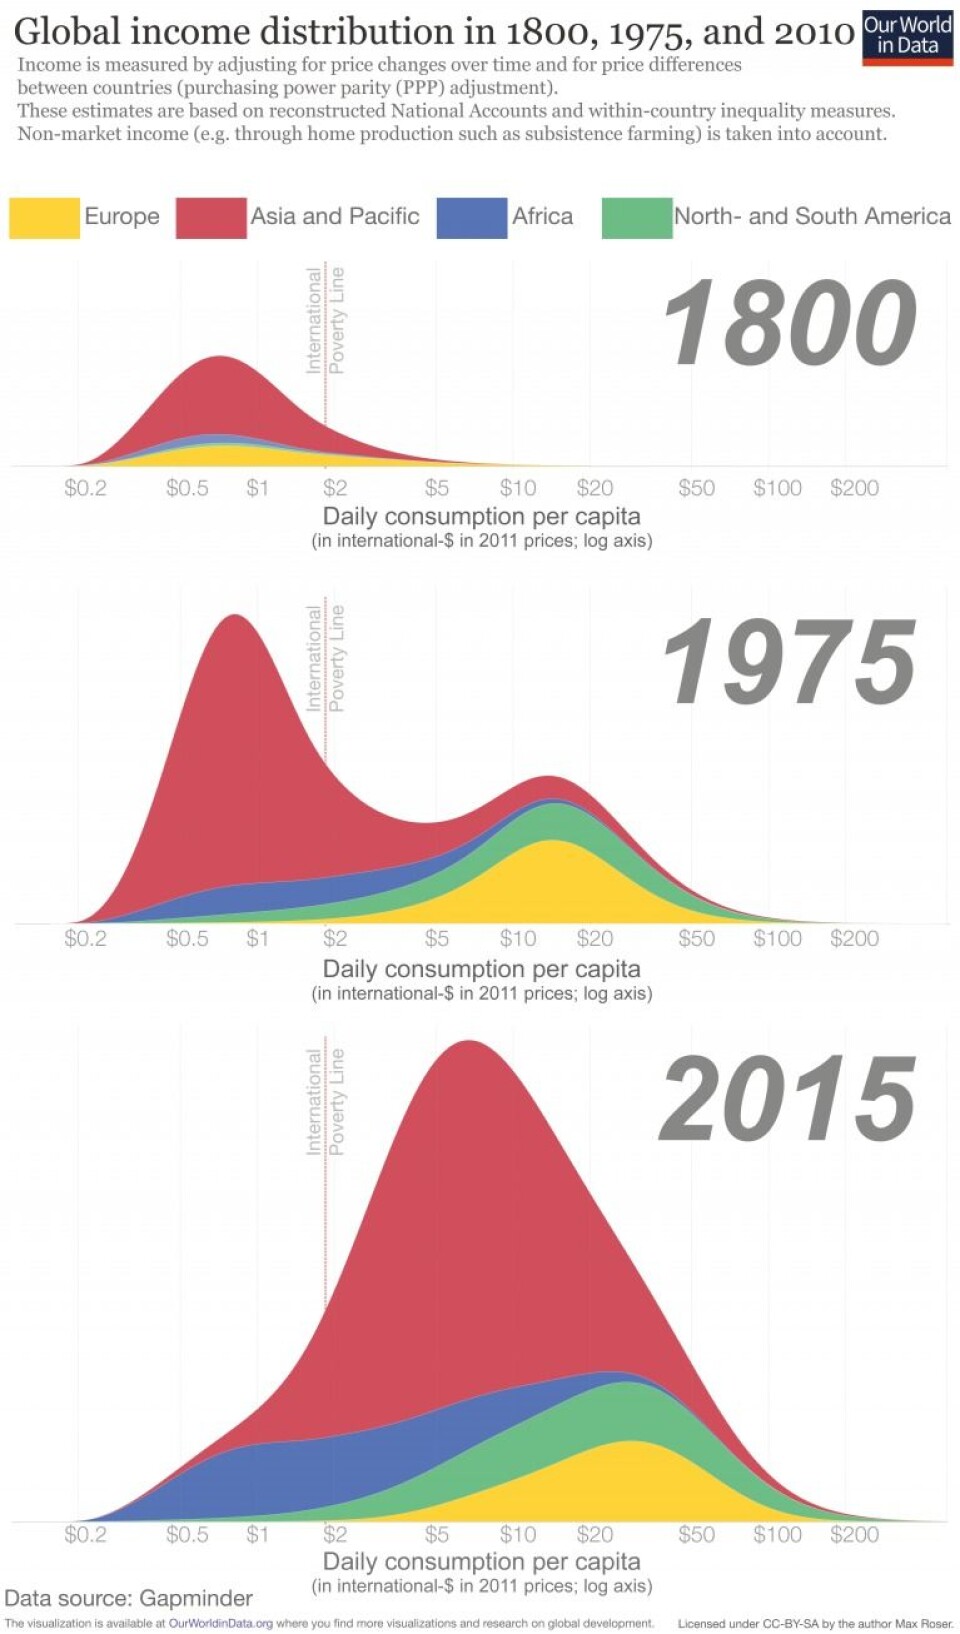
This perspective concerns how data visualization contributes to the way we view the world on a more basic level. For instance, is it true that large economic differences – or poverty - is but a natural state of affairs? Or, are differences in income between men and women a natural consequence of biological differences? Sometimes, data visualization illustrate such issues.
Consider, for instance, how data may present social inequality as dramatical or critical, or, on the other hand, as both natural and inevitable. Used in this manner, data visualization may contribute to both maintaining and challenging preconceptions that we take entirely as given.
How most people think about these questions, is vital to politics. If most people believe that significant economic differences should not be considered a problem, but rather as a natural state of affairs, then the support for upholding a comprehensive and active welfare state, may be weak.
See the infographic: Global income distribution in 1800, 1975, and 2010.
3. Data visualization and citizenship
This perspective deals with the question of how data visualization may contribute to helping people fulfil their role as citizens.
Unless people have a relatively well-developed understanding of the issues that are important in a society, or even worse, do not care, there is a real danger that democracy will not function.
Data can assist people in understanding issues and connections that are quite complex. One such issue that comes to mind is the nature of the connections between people’s level of education and their health.
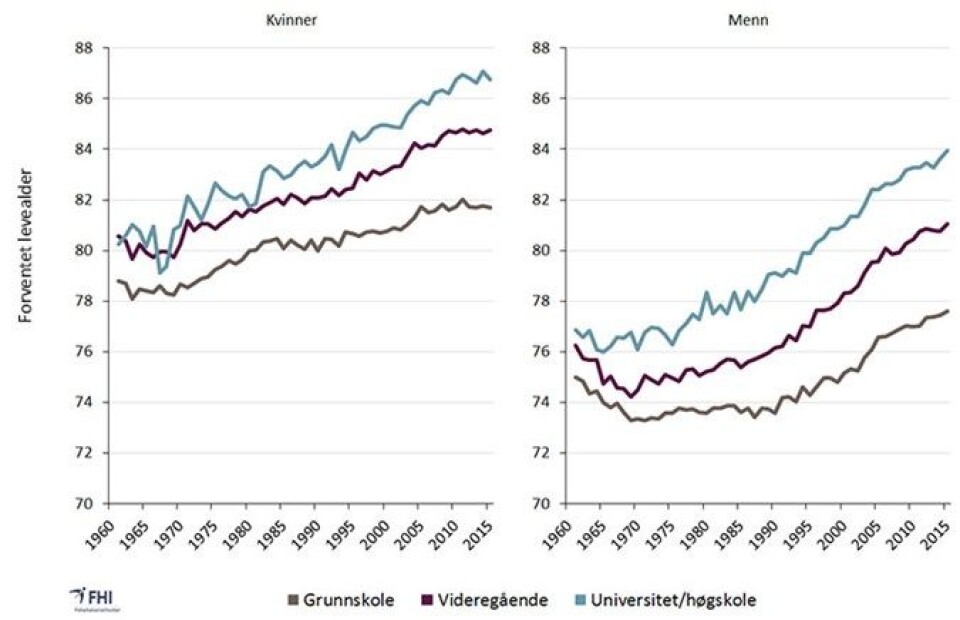
Take a look at the two line charts above, which show the life expectancy of women (left) and men (right) in Norway, according to education. The grey line represents the life expectancy of men and women with a high school education, purple indicates a college education, and blue indicates a tertiary, university education.
Data visualizations also have the potential of contributing to peoples’ involvement in issues that are important to society. Visualizations of global poverty may for instance increase the level of involvement concerning third-world countries. Another example is how visualizations of systematic wage differences between men and women can lead to increased involvement in issues concerning equality.
4. Data visualization as a political steering tool
This is a perspective that focusses on the use of visualizations as a basis for policy development or decision-making – most often by politicians or other people in power.
Climate politics is a good example.
Annonse
Based on research, the United Nations climate panel regularly presents climate reports to politicians. An essential part of these reports is devoted to data visualizations which show possible future scenarios. The visualizations, then, function as a tool for developing climate policy and for setting targets for climate development.
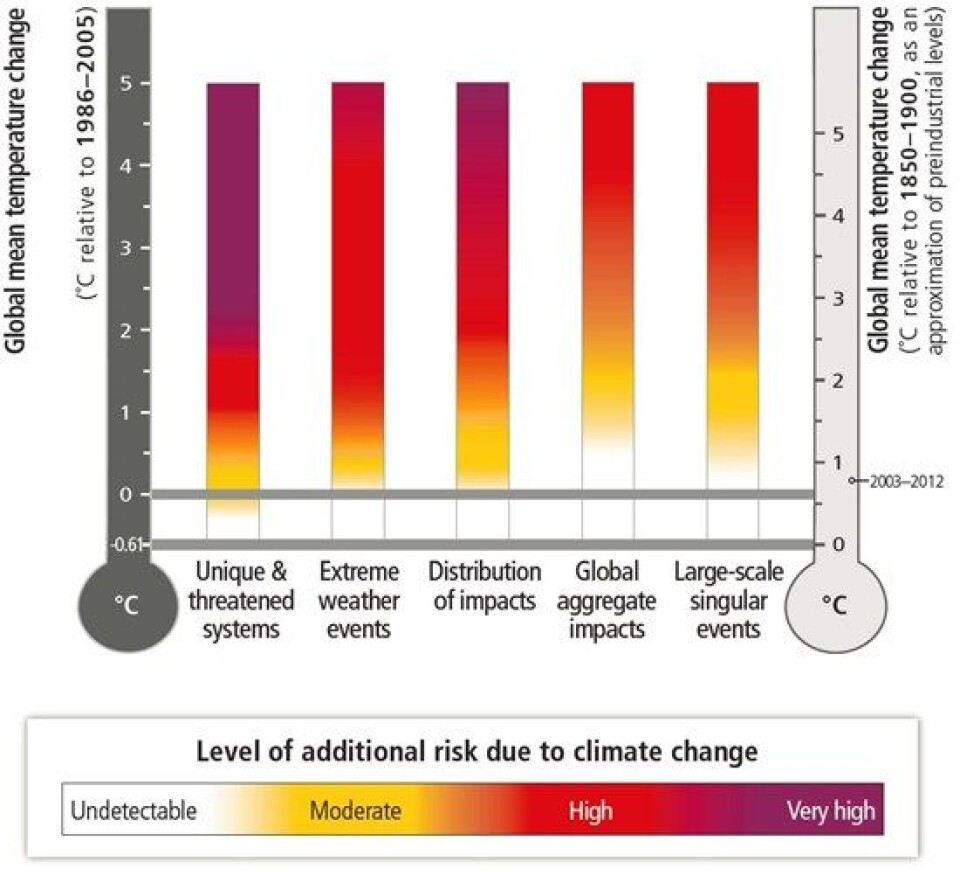
This example shows that data visualizations may have a direct impact on politics, as illustrated in the "burning embers" column charts below from the latest IPCC special report on cliamte change at 1.5oC.
With these four perspectives, I have tried to present some of the ways in which data visualizations may be of importance to democracy and politics. However, it is also important to mention that these perspectives may overlap: two or more perspectives may be relevant to one visualization. Some of these perspectives illustrate how data visualizations can have a direct impact. As demonstrated above, data visualizations may, for instance, have a direct impact on how people choose to vote in elections or how policy is developed. However, other perspectives show how the impact of data visualizations may be of a more indirect nature. They may increase political involvement, or affect how people perceive the complexities of the world.